Use widgets on the Collections dashboard
The Collections dashboard gathers in one place all the data from your last import. Select General Dashboard to see data from every company in your portfolio or select a specific company from the left panel to see just that company's data. The dashboard contains several widgets, each displaying a different KPI.
You can choose the widgets that appear on your dashboard and the order they appear. Learn more
Account trade information
This widget displays a link that redirects users to the trade information tab in the account page.
Aging balance chart
This widget visualizes your aging balance as a line chart. Arrears are sorted into line segments according to their due date. The length of each segment corresponds to the sum of invoices that fall within that range. Two figures are displayed above each segment: the balance of arrears in that category and this figure expressed as a percentage of all arrears.
- Arrears are grouped by age, ranging from invoices not yet due to those past due by more than 365 days. You can customize these ranges by contacting the Support team.
- The sum of overdue segments (i.e., all invoices except those not yet due) is the same amount as the due balance in the collector progress widget.
- The aging balance is the same amount as your outstanding balance, just differently displayed.
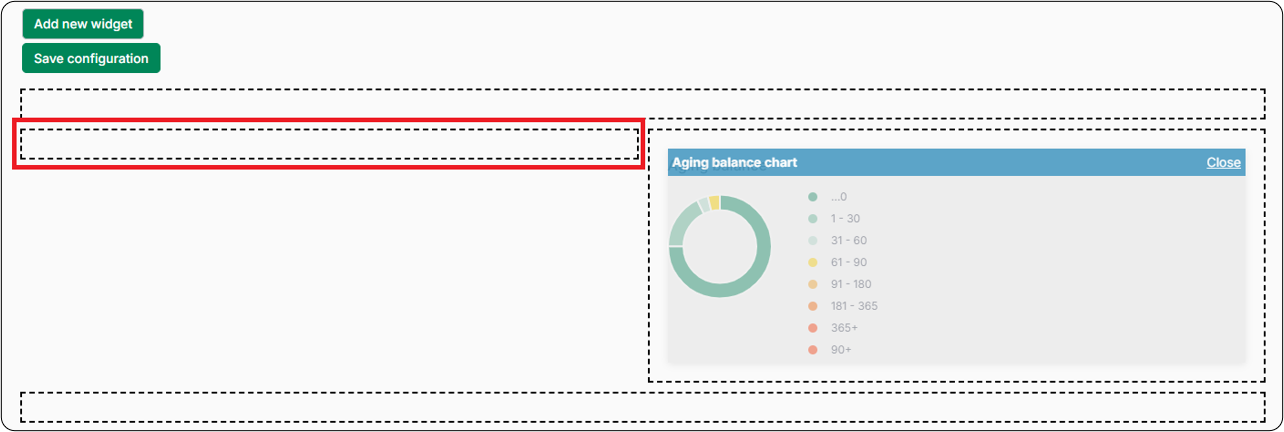
You can also display aging balances as a circle chart. Select Edit page lay-out > Add new widget > Aging balance chart, then drag the widget to one of the half-width spaces on the layout page.
Average days due
Also known as average payment behavior, this widget displays the average number of days that invoices are overdue. Averages are displayed for the last and current weeks. In the evolution indicator, you can see whether overdue invoices are increasing or decreasing over time. When the indicator is green, overdue invoices are decreasing. When the indicator is red, overdue invoices are increasing.
Collector actions
This widget shows the total number of actions taken by a collector: the number of emails and letters sent, and the number of phone calls made. Select the dropdown to see the number of actions taken today, last week, or last month.
Collector progress
This widget has two parts, a summary list and a circular progress indicator. The summary list includes the following items:
-
Outstanding balance: the sum of all outstanding invoices in Collections
-
Due: the sum of open invoices past their due date
-
In promise: the sum of open and promised invoices
-
In dispute: the sum of open and disputed invoices
-
In payment plan: the sum of all open invoices on a payment plan
The tasks indicator shows, as a percentage, the workspace actions you've completed, increasing gradually from 0% to 100% as the day progresses.
Collector progress metrics vary by user owing to the different portfolios in the user's account.
Credit review actions
This widget shows a set of actions used to manipulate a credit review.
Credit review data
This widget shows a table containing general information about a credit review.
Dynamic report chart
This widget displays, as a chart, data from your dynamic reports. After selecting the widget, select Options and then use the dropdown to select a chart.
Next review date
This widget shows a table containing general information about the next credit review date.
Payment evolution and cash forecast
This widget shows past payment behavior in order to forecast how payments are likely to evolve in the future. Using past payment data, Billtrust Autopilot makes an intelligent cash forecast, allowing you to predict inflows with precision and model working capital needs.
-
The graph shows data from the past six weeks. Each bar in the graph displays the sum of all invoices archived in a given week.
- The date underneath the bar is always the last day of the week.
- Invoices with a negative amount are also included in the graph. This makes it possible to have a negative result.
User tasks
This widget shows a table of the current user's outstanding tasks.Top bad accounts
This widget can be configured to show either disputes, broken promises, or divergent payment behavior.
| Disputes | Shows the top 5 accounts with the highest number of disputed invoices. The amount due is the sum the debtor owes, regardless of due date. |
| Broken promises | Shows the top 5 debtors with the highest number of invoices past their promise date. |
| Divergent payment behavior | Shows the top 5 debtors with divergent payment behavior in the last 6 months. Divergent payment behavior is calculated as follows:
|